Reading time: 3 min read

Create A Report To Monitor Query Suggestions
An often overlooked aspect of Query Suggest is understanding how the model itself is performing. You might be curious how often a query is suggested to a user. What words are performing better than others. This might be great for your marketing team because you can use this information to create featured items.
Steps To Create A Query Suggest Report
The following steps will guide you through creating a report to monitor your Query Suggest model.
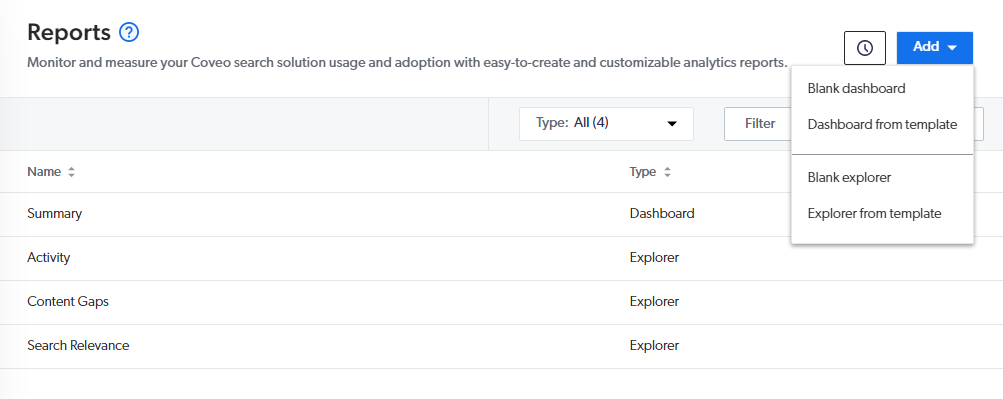
Create A Blank Report
In Coveo Cloud Platform Admin go to Models and then in the top right corner click Add and select Blank dashboard.
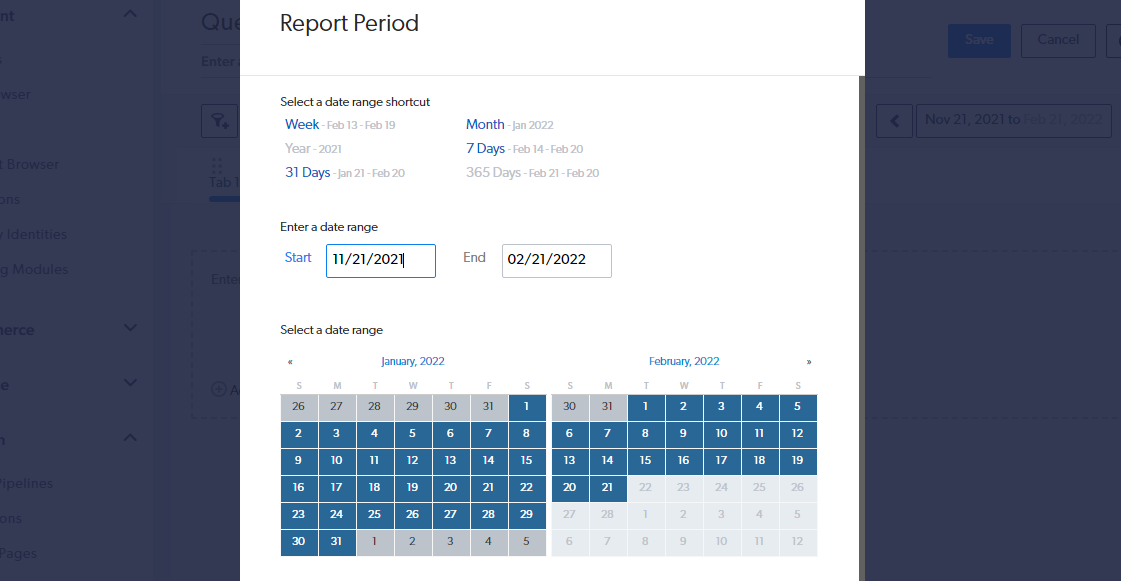
Update The Date Interval
It's often useful to match the report to the date interval you used for your model's learning. In this case, set it to three months.
Add Appropriate Filters
We're going to add four filters to our report.
- Add
User Query isNot blank or n/a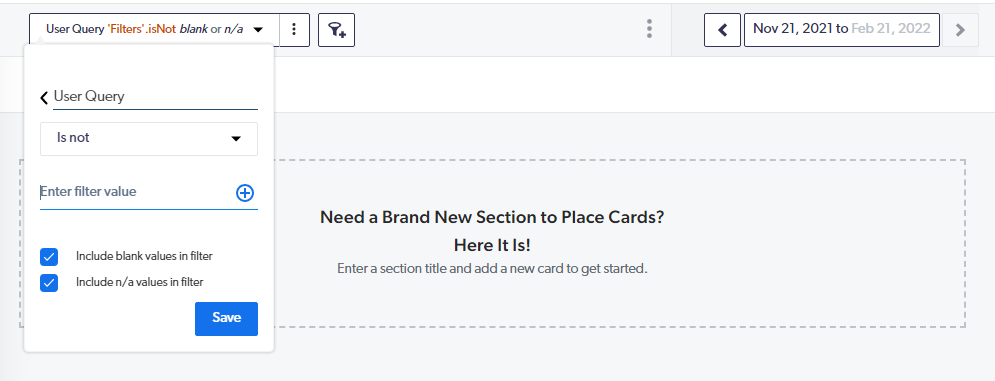
- Add
Origin 1 (Page/Hub) is <Search Page> or <Search Hub Name>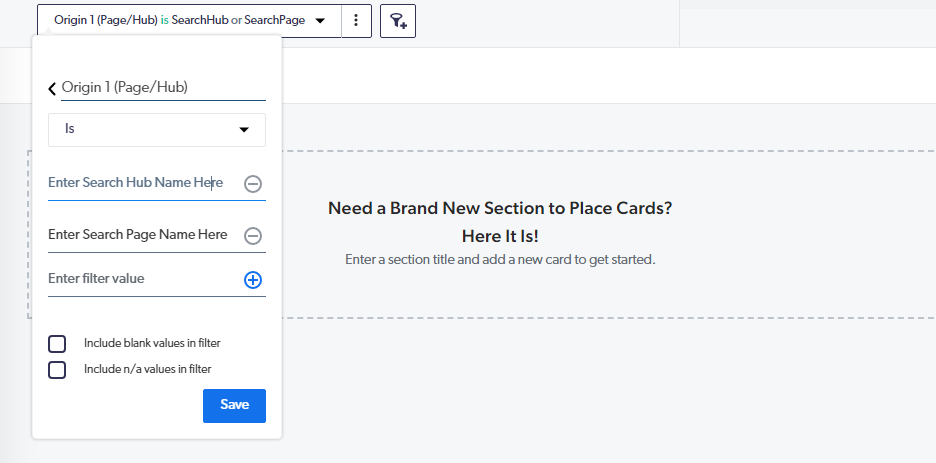
- Add (Optional)
Origin 2 (Tab/Interface) is <Tab Name> or <Search Interface Name>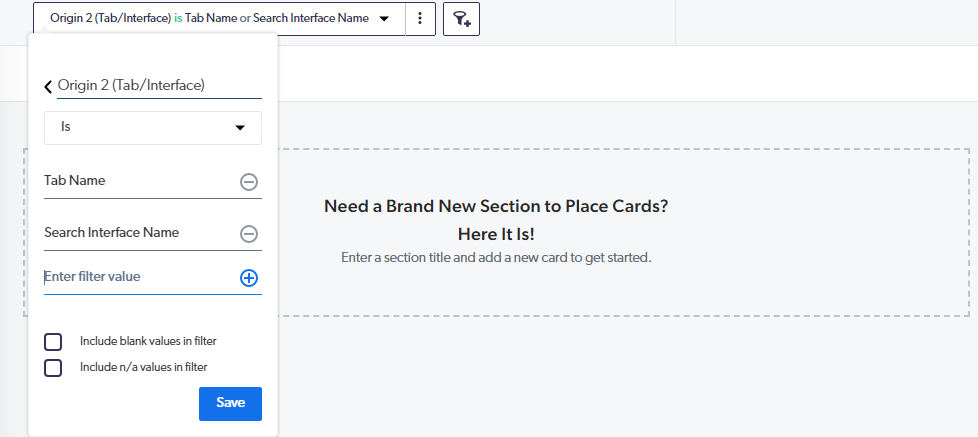
This only applies really if you have separate tabs.
- Add (Optional)
Language is 'en'. If you have only one language, obviously this is not required.
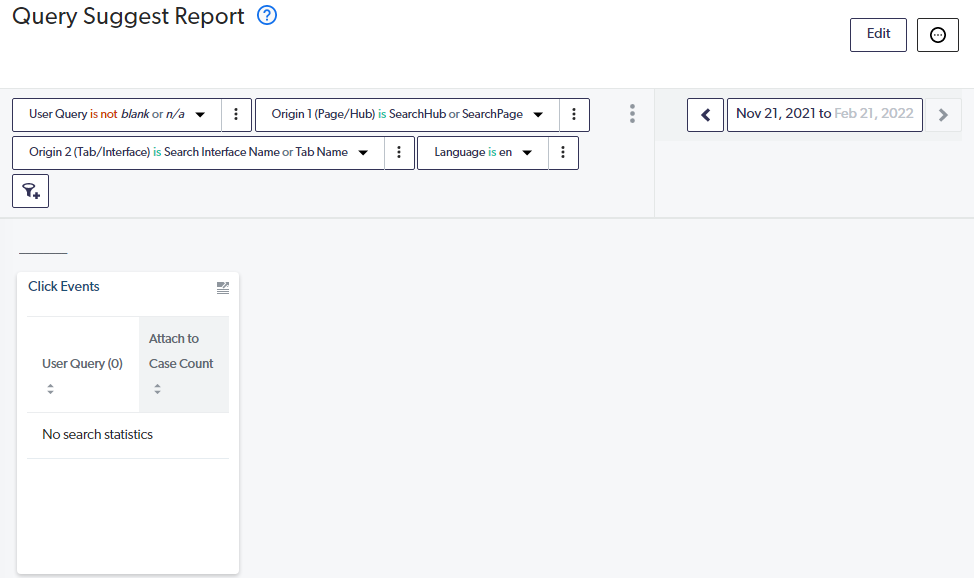
Add The Card To A Section
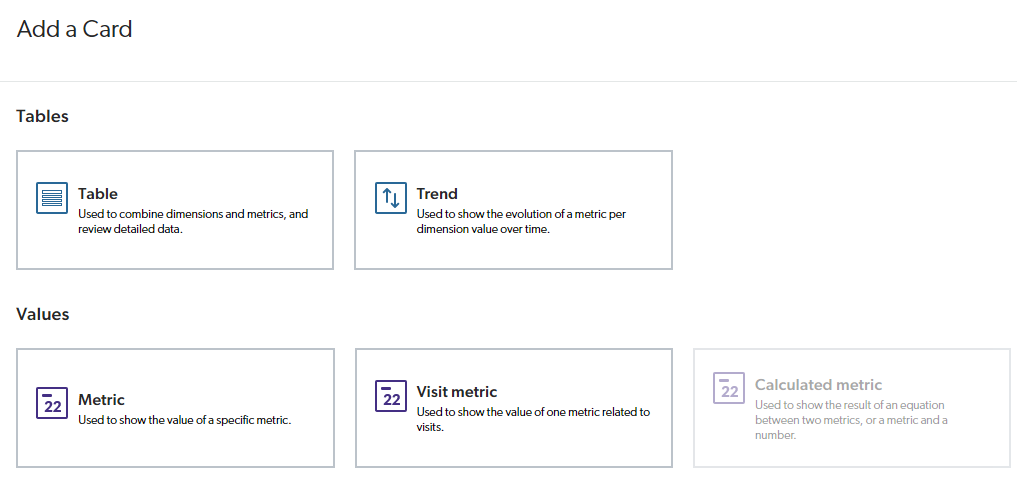
Click Add card to section followed by adding a Table card.
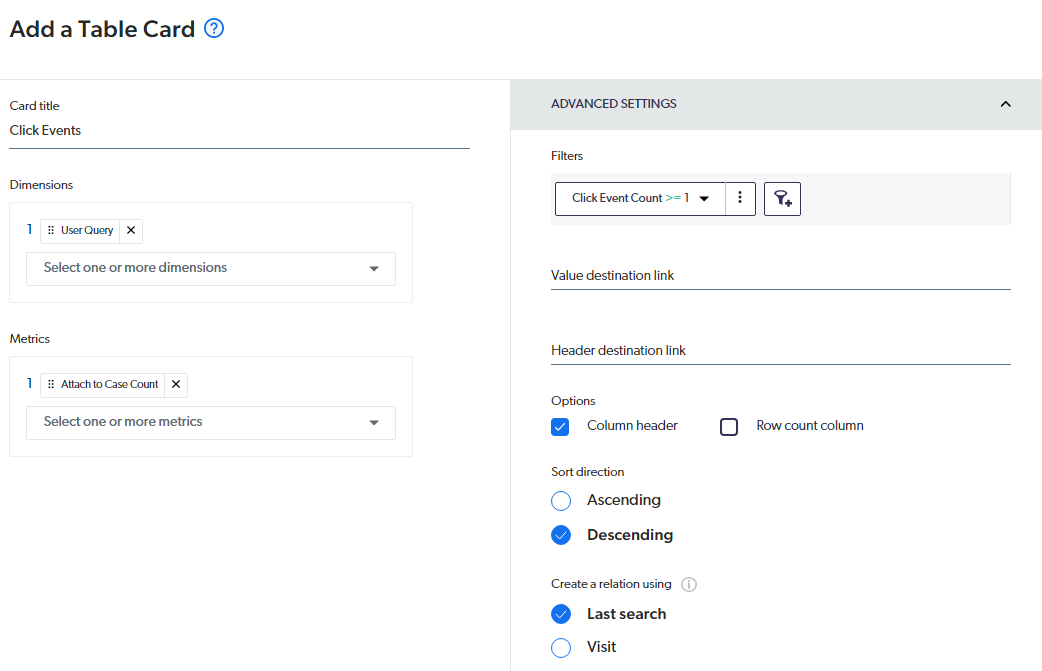
In Dimensions add User Query. And in Metrics add Click Event Count.
In the filters on the right, add a filter such that Click Event Count is greater than or equal to <X>.
The value of <X> is determined by the number in the table found on this page. Such that depending on how many queries your site has, the value of <X> needs to be updated. As your site grows you'll need to come back to this filter to update it.
Save Your Report
Save the dashboard and after your search has been used, you should now see results show up showing the queries suggested and how many times they have been suggested. Note: If your site is just launching it's quite possible this report will be empty.