I get asked this question all the time:
“If we set Sitecore analytics up, does that mean we don’t need to use Google Analytics anymore?”
The short answer to this question, is that Sitecore analytics isn’t a replacement for Google Analytics, rather both platforms complement each other and are great to use together for different insights, which we will explore in this blog.
What we'll cover:
Let's look at Sitecore analytics first.
Sitecore Experience Analytics
Sitecore Experience Analytics is an app by Sitecore that comes with Sitecore Experience Profile (XP).
Experience Analytics provides you with a dashboard and reports so that you can analyze patterns from your website and other data sources.
Sitecore Experience Analytics is based around a metric called Engagement Value. You need to assign engagement value scores to everything you want to track on your site.
Click here to read my blog about setting up Sitecore personalization, which goes over setting up engagement value points in detail.
Tracking engagement value means that you won’t just be tracking quantity like you do in Google Analytics with pageviews, but you’ll also be able to track the quality of interactions.
Why Should I Use Sitecore Experience Analytics?
Measures Quality Of Your Content
Sitecore Experience Analytics allows you to measure whether visitors are engaging with your content (meaning it’s high quality), rather than just the quantity of interactions.
Because of the way you set Experience Analytics up, you assign goals with a number of points to every interaction that you’d like a visitor to complete on the site, i.e. completing a form, downloading a brochure or viewing a promotional blog.
This allows you to see whether a visitor performed the action that you’d like them to, or viewed the information you’d like them to see, instead of just viewing how many visitors a particular page has and how long they stayed on that page, which isn’t a good metric to use when gauging whether your site is performing well, or trying to determine the experience a visitor has with your brand.
This is particularly true when a visitor gives away their personal information in exchange for something you’re offering (i.e. a gated ebook), which is the ultimate form of trust, and sign of commitment.
Take this scenario, compared to just viewing the number of page visits and your data shows you a very different picture.
Your homepage might be the most high traffic page on your site, but that doesn’t necessarily mean that it’s the highest quality page.
With this deeper insight that Sitecore Experience Analytics gives you, you can see which pieces of content visitors are engaging with most, and which content needs some tweaking and optimizing.
Measures Customer Value
With Sitecore Experience Analytics, you can measure the value of every visitor to your company.
All website visitors aren’t equal.
You may have a blog article that trends well on Google for a query with a high search volume.
Therefore your website might be receiving a large amount of traffic that are just on your website to read this blog, and then ‘bounce’ off your site.
These visitors aren’t worth nearly as much to your company as a visitor who visits your website through a branded keyword (indicating they are further along in their research journey), and then views product pages, downloads an eBook and signs up to the newsletter.
With Sitecore Experience Analytics, you can see the value that a visitor has to your business, and how ‘hot’ they are (i.e. whether their actions indicate they are nearly ready to purchase).
This is valuable information for your sales team who can then spend their valuable time contacting those contacts, rather than contacts who only viewed one blog and bounced from the site.
Deep Campaign Performance Insights
The goal of a marketing campaign usually isn’t to generate website traffic - it’s to generate a conversation (whatever that may be to your organization).
The flaw that many marketers make, is tracking campaign success based on how many visitors came to the website from a particular campaign (i.e. how many website visitors came from the social media post on Thursday).
While this is a great first step, you ultimately want those visitors to complete a specific action once they make it to your site. Therefore just measuring website clicks isn’t a true indicator of the success of that campaign.
Sitecore Experience Analytics allows you to easily track a campaign’s success rather than just one aspect of the campaign.
See Full Visitor Journeys On The Site
With Sitecore Experience Analytics, you can see the full journey that visitors took on the site, including what pages they visited, what forms they filled in and what content they interacted with and downloaded.
This is incredibly useful not only for your marketers, but also for your salespeople, or customer service staff.
You can trigger certain actions such as marketing automation campaigns, or notifications to your salespeople or customer service representatives when a customer or lead performs certain actions on the site. I.e. if a lead has returned to the site and is viewing your case studies page, you can send a notification email to your sales rep to let them know that the lead is definitely interested and potentially ready to buy.
Where Should I Look In Sitecore Experience Analytics?
Dashboard
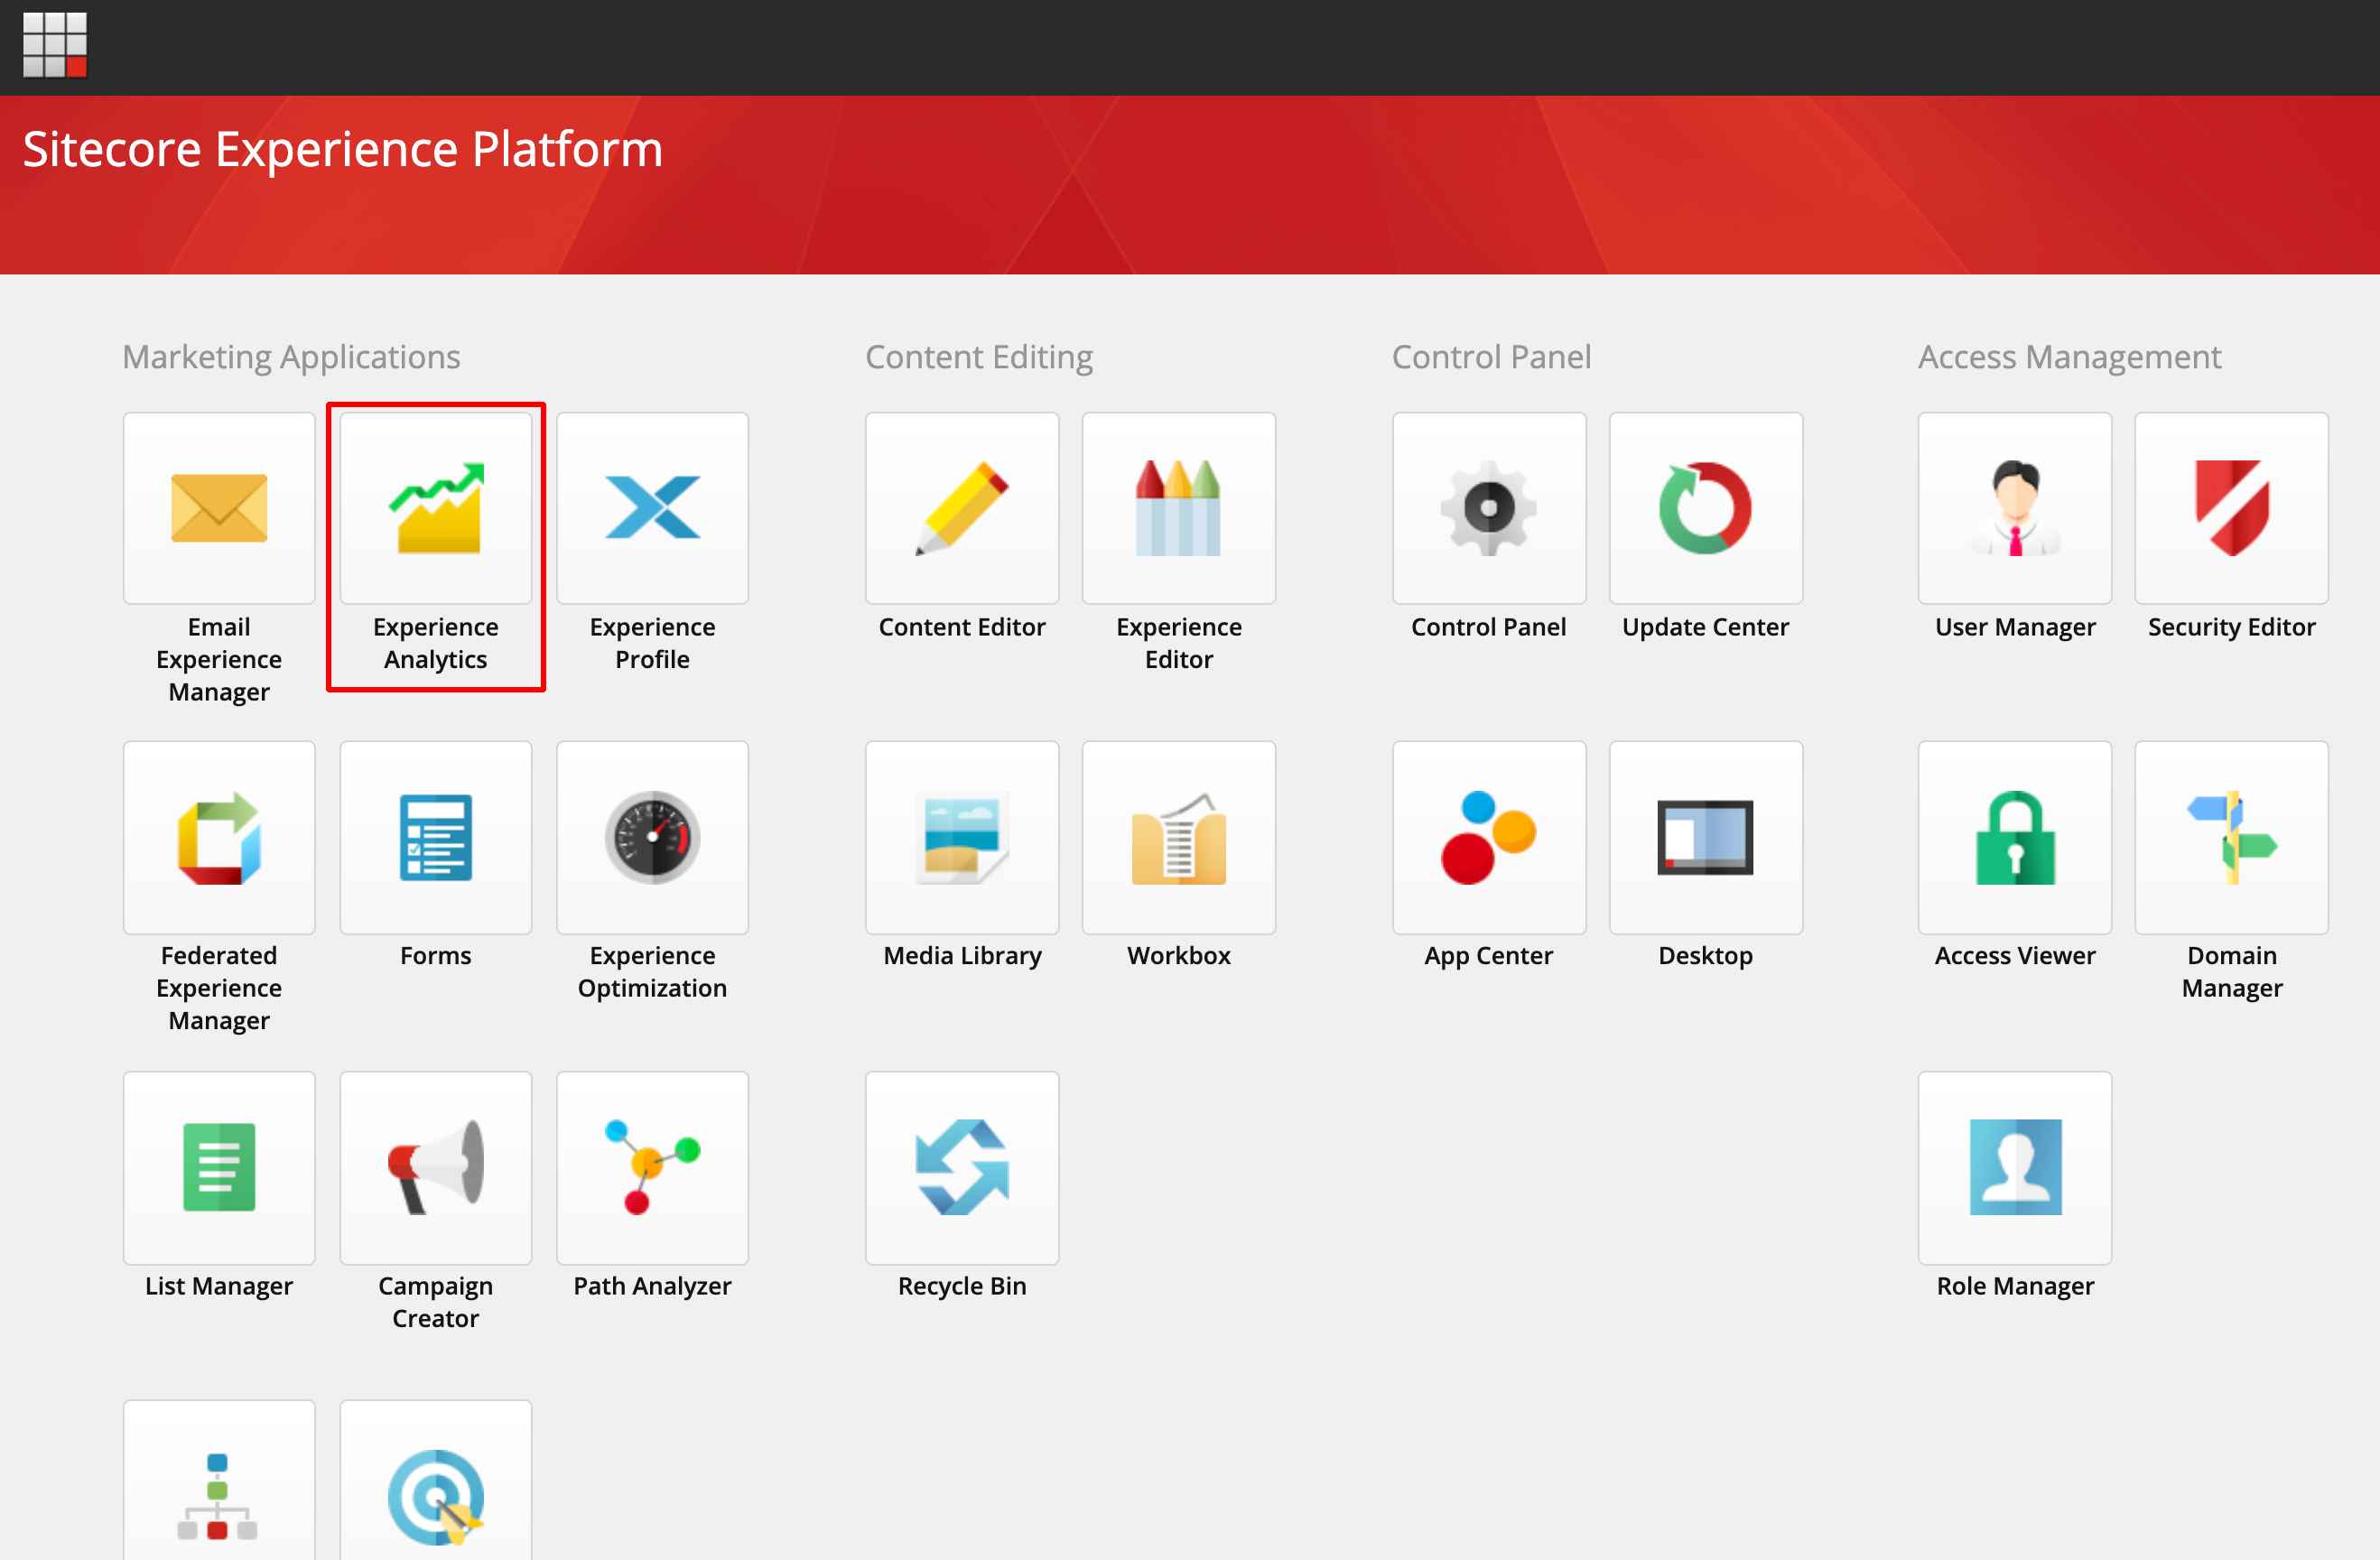
In the Sitecore Launchpad, click on Experience Analytics.
Set the date range in the top left corner, and choose which site you want to filter by.

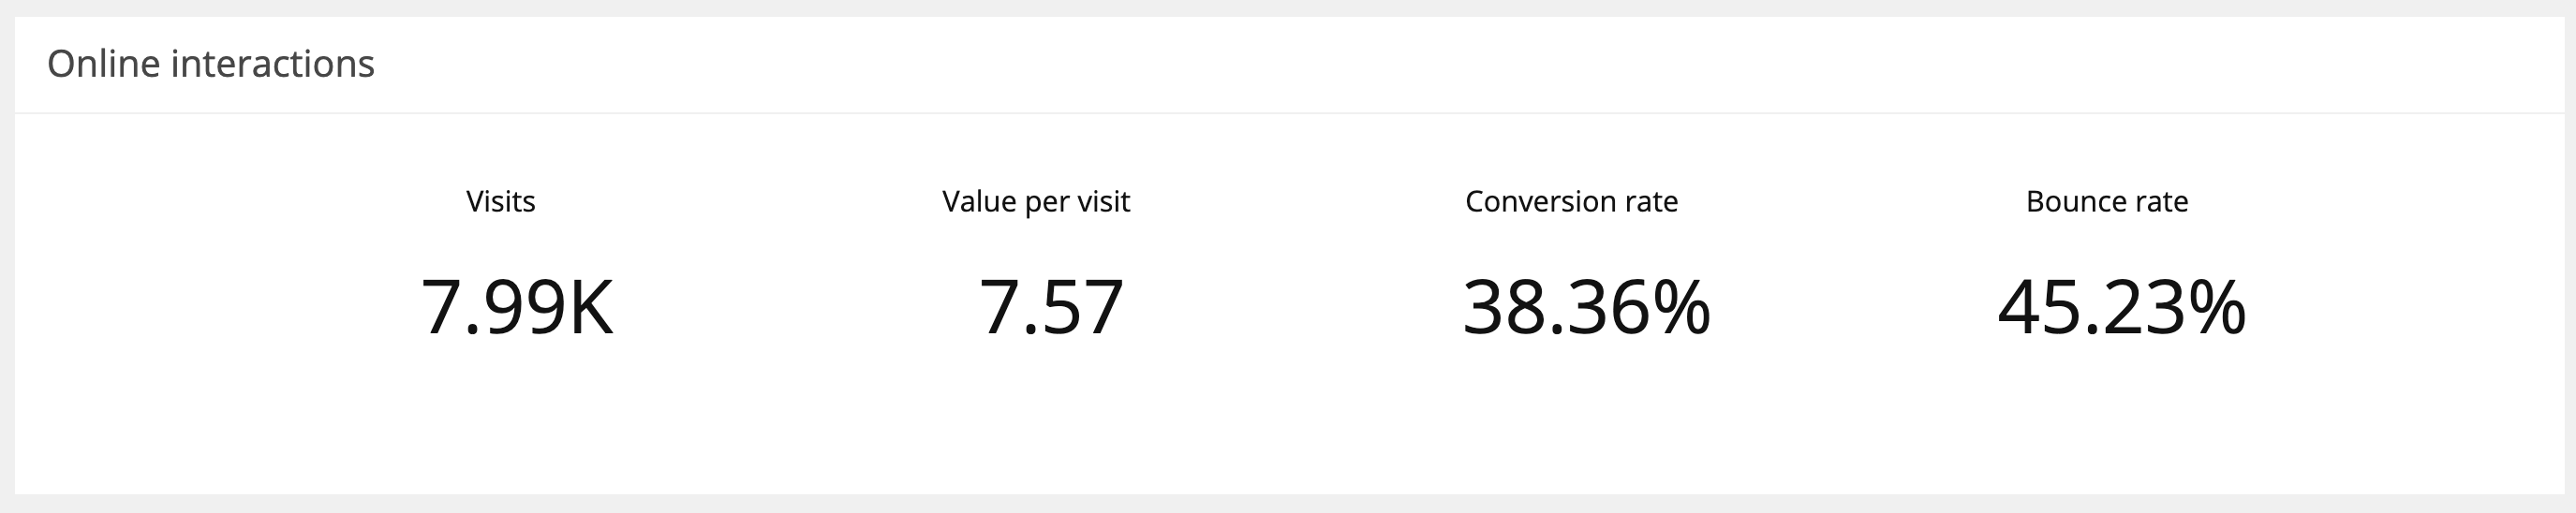
Here you’ll have a view of the number of visits to your site, the value per visit (determined by how many engagement value points were achieved per visit), as well as the conversion rate (number of website visitors / number of goal conversions), and bounce rate.
It’s important to note that these metrics are dependent on when you set Sitecore Experience Analytics up properly.
For example, if you didn’t set engagement value goals up properly, you’ll likely have incorrect data displaying here, which is why the set up of goals is so important.
You can also see:
- Your top campaigns by value (which campaigns have the highest amount of engagement value points)
- Top pattern matches by value per visit (which campaigns are performing the best based on engagement value points)
- Top goals by count per visit (shows which goals have been reached the most)
These are the baseline metrics to track in Sitecore that will give you a good insight into how your content is performing.
Audience Reports
The audience reports show you location data about your website visitors (top countries and cities), as well as pattern matches and top languages by visit.
Pattern Matches
Pattern matches (Under Audience, and then Pattern matches in the left side navigation) are matches of pattern cards that you’ve set up.
Pattern cards are cards that reflect behaviour and interests of specific types of contacts that come to your site.
The way this works is by assigning values to pattern cards and using them to identify patterns of activity on your site.
You can also use them to start personalization activities.
Acquisition Reports
The acquisition reports show data about the sources of traffic that users used to enter your site. You can view this data by:
- Top channels by visits
- Top campaigns by visits
- Top campaign groups by visits
- Top referring sites by visits
Behaviour Reports
The behaviour reports show you data that helps to analyze the behaviour of your site visitors and contacts.
- Top downloaded asses by count (most downloaded content)
- Top internal keywords by count (keywords with the highest search volume on your internal search)
- Top entry pages by count (pages with the highest number of entrances)
- Top outcomes by visits (outcomes that have resulted from website visits)
Conversions Reports
The conversions reports show you which actions on your site result in the highest conversions (generate the most value), which goals are converting the most and a summary of conversions.
Online interactions by conversions and conversion rates (shows you the number of conversions and conversion rate (number of visits that resulted in conversions))
- Top goals by count (most converting goals)
- Conversions by visits (Number of times your contacts convert when they visit the site)
- Conversions by page views (Number of times your contacts are converting, by page views)
Google Analytics
Google Analytics is a free app by Google that gives you analytics and metrics about your website and how website visitors are interacting with your site and site pages.
It gives you a great overview of how your website is performing, and some surface level insights into what kind of visitors are coming to your website, and what devices they’re viewing your site on.
Some questions analytics can help answer about your site are:
- How many visitors does my website get?
- Which pages are the most popular?
- What channels is my website traffic coming from?
- Which locations are my visitors browsing from?
- What devices do my visitors use?
As well as the basics, you can configure Google Analytics to make inferences on marketing campaign performance, the performance of social media posts, ad performance or button clicks on the site. You can also connect other systems to Google Analytics, such as your CRM.
Why Should I Use Google Analytics?
It’s Free
It’s a free app, so you don’t have to pay for it, subscribe or give Google your credit card details.
All you need to do is add a snippet of tracking code to your website's source code or your Google Tag Manager account, and you’re good to go.
Display Of Data
The possibilities are nearly endless in Google Analytics for data display.
You can compare multiple data sets, different date ranges, display data in a pie chart or a graph, you can filter by almost anything….the list goes on.
Google Analytics can also be easily integrated with Google Data Studio, so you can pull metrics of interest into a dashboard that you can share with your stakeholders.
Real-Time Metrics
Google Analytics collects and displays data in real time.
This is great because you don’t have to wait to check your analytics data periodically - you have it right there for you, whenever you want to see it.
There’s also an entire section of the site dedicated to viewing real-time data.
So you can see exactly how many visitors are on your site right at each very moment, where they’re browsing from, and how they got to your site.
Audience Insights
Google Analytics gives you information about who is viewing your site, including where they’re browsing from in the world, their age, what their interests are and what gender they are.
Although not a complete picture of your audiences, it at least gives you an insight into what your target audience may look like when it comes to their gender, age and location.
Website Behaviour
You can make a lot of inferences about your website content by analyzing Google Analytics behaviour data.
Metrics such as time on page, bounce rate and exit page can give you an idea of whether visitors are enjoying your content, or whether it’s not well received.
Be careful with this one though, as we don’t know the real motivations behind some of these metrics.
What I mean here, is that someone could spend an hour on a page, and someone else could spend 10 minutes on the same page.
But you don’t know how they received the content. Longer time on page, doesn’t necessarily mean they enjoyed the content more.
It might mean their kids started crying and they had to step away from the computer.
Nonetheless, these are still interesting metrics that give you some understanding about behaviour on your site.
Where Should I Look In Google Analytics?
The metrics and analytics that you track depend completely on your goals.
However, if you’re new to Google Analytics and want to understand what areas you should look at, these will give you a good overview of your site:
Demographics
Location: Audience > Demographics
Knowing the age and gender of your website visitors gives you an indication of the age range and gender of your target audience, since your website visitors are usually a pretty accurate reflection of your target market.
Location
Location: Audience > Geo > Location
This metric allows you to see the location of your visitors, from the country right down to the city that they’re browsing from.
Google Analytics uses the IP address of the visitor, and this data may not be completely accurate, as it shows where their Internet connection is, rather than their actual location.
This means if they’re using a VPN, GA will likely show their ‘location’ incorrectly. A similar instance occurs with mobile devices, which can often show an incorrect city.
New Vs Returning Visitors
Location: Audience > Behaviour > New vs returning
This metric is an interesting one that a lot of people don’t know what to do with.
Particularly because it can mean a number of things.
Like all GA data, we can only make inferences from it.
If a large percentage of visitors are returning to the site, and the purpose of your site is to generate leads or to make a sale, then that could signal to you that you need more strategies to convert them on the first visit.
It could also mean that visitors are enjoying your content, particularly if you write a lot of blogs, and they’re returning to the site to read more of your content.
Devices
Location: Audience > Mobile > Overview
This allows you to see what % of visitors are visiting your website on a mobile, tablet or desktop device.
This is useful for UX design and content creation. If most of your visitors browse on mobile devices, then you want to ensure your website is optimized appropriately.
Key Google Analytics Metrics
Location: Behaviour > Site content > All pages
This report gives you an overview of:
- the most viewed pages for the date range (shows the total number of pages viewed, even if they were repeated views)
- number of unique pageviews (aggregates page views that are generated by the same user during the same session)
- average time on page (shows the average amount of time a user has spent viewing a page)
- number of entrances (the number of times an entrance was made to the site through the page)
- bounce rate (shows the percentage of sessions where there was no interaction with the page. In a bounced session the visitor enters and leaves the site via the same page)
- % exit rate (percentage of visitors that exited the website on this page)
Exit Pages
Location: Behaviour > Site content > Exit pages
Pages with a high exit rate indicate that most visitors on the website who also viewed those webpages, only came to the site for that particular page.
Landing Pages
Location: Behaviour > Site content > Landing pages
Landing pages show the pages that visitors entered the site on. It’s important to remember that these pages are the first experience your visitors have with your website and oftentimes with your brand.
It’s a very old school point of view to view the homepage as the first point of contact with your website, particularly with the surge in blogging and interest in SEO. It’s important to ensure that you are also funnelling visitors from your top ‘landing pages’ to other pages on your site.
Source / Medium
Location: Acquisition > All traffic > Source/Medium
This shows Shows the sources and mediums that most visitors entered the site from, i.e. Google or direct.
This gives you an idea of how your website is performing on different channels (i.e. Google / social media), as well as where you can make changes to acquire more traffic from different channels.
Social Referrals
Location: Acquisition > Social > Network referrals
Shows which social media channels visitors come from.
You can then click into each social media network and view the content that visitors were referred to the site from.
Oftentimes you’ll post on social media with the hopes of attracting visitors to your website from that post.
You might post a link back to your site with a call to action (CTA).
This is a great place to see whether those posts were successful in attracting visitors and which social media platforms are the most successful.
Session Durations
Location: Audience > Overview
Gives you an indication of how long visitors are on your site for.
Be careful with this metric as it’s not always clear whether longer time spent on page is a good thing or negative thing.
It’s good to do some in person user testing and see how long it takes you to read the page of content and complete the CTA on the page.
If the time on page is a lot shorter than what your test indicated, it’s probably an indication that your content isn’t compelling enough and users are leaving the page shortly after entering it.
If the time on your page is longer than expected, this could indicate that your content is confusing, and users are spending a lot of time trying to digest it.
Content Drilldown
Location: Behaviour > Site content > Content drilldown
This report shows you the most common paths users took on your site.
This is great for seeing if the path that you’d like a user to take on your site aligns with the path that visitors are actually taking.
It’s also great for understanding how to optimize the site, based on the most popular pathways that visitors are taking.
Wrap Up
Both Google Analytics and Sitecore Analytics are great tools that should be used together to have a full 360 degree view of your customers, prospects and website performance.
Google Analytics is great for baseline analytics that show you how your website is performing, and Sitecore Experience Analytics is great for measuring website engagement and performance as it pertains to your website's goals.
Thanks for reading! If you'd like more blogs like this one, please let me know on Twitter
@natmankowski, or send over any questions you have.
Editor's Note: This post was originally published in November 2020 and has been revised and updated for accuracy and comprehensiveness.